See invisible electromagnetic waves around you!
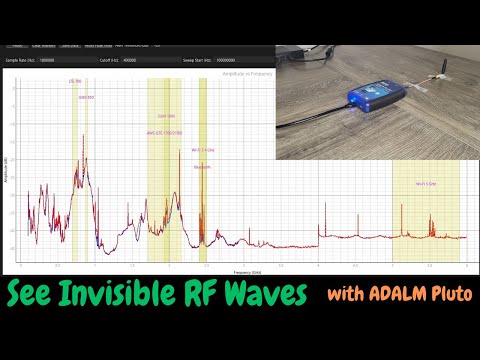
This project turns an ADALM Pluto SDR into a real-time Spectrum Analyzer using Python and PyQt, allowing you to visualize Wi-Fi, LTE, GSM, Bluetooth, and other RF signals that are constantly present in our environment.
🎬 Watch the full video demo and tutorial on YouTube:
Have you ever wondered what the world around you would look like if you could see the invisible electromagnetic waves — like Wi-Fi, LTE, GSM — that are constantly traveling through the air?
In this project, we build a real-time Spectrum Analyzer using ADALM Pluto SDR and Python, allowing us to "see" those signals and explore the electromagnetic spectrum right from your desk!
- The SDR sweeps across frequencies, measuring amplitude of each frequency using a lock-in amplifier technique.
- The received signal is mixed with the SDR's Local Oscillator (RX LO) to down-convert the desired component to DC.
- A low-pass filter extracts the amplitude of that component.
- The process repeats for every frequency step, generating a real-time spectrum of everything around you!
- ✅ Real-time wideband frequency sweep and visualization
- ✅ Peak hold and threshold-based alerts
- ✅ Draggable markers for easy analysis
- ✅ Highlights known bands (Wi-Fi, LTE, GSM, Bluetooth, etc.)
- ✅ Fully adjustable sweep and filter settings via GUI
- ✅ Data export to CSV
- ADALM Pluto SDR
- Python 3
- PyQt6 (GUI framework)
- PyQtGraph (real-time graph plotting)
- NumPy & SciPy (signal processing and filtering)
git clone https://github.com/fromconcepttocircuit/ADALM-Pluto-Spectrum-Analyzer.git
cd ADALM-Pluto-Spectrum-Analyzerpip install pyadi-iio numpy scipy pyqt6 pyqtgraphIf you're on Linux, install this to avoid missing Qt plugin errors:
sudo apt install libxcb-cursor-devpython spectrum_analyzer.py- Make sure ADALM Pluto is connected and reachable at its default IP:
192.168.2.1. - You can adjust the IP address in the code if necessary:
self.sdr = adi.ad9361(uri='ip:192.168.2.1')- Sample Rate (Hz): Adjust sampling speed.
- Cutoff (Hz): Set filter cutoff frequency.
- Sweep Start/Stop (Hz): Frequency range to scan.
- # of Points: Resolution of the sweep.
- Threshold (dB): Level to trigger alerts.
- Peak Hold / Markers: Analyze signals in detail.
- The IP
192.168.2.1is the default address for ADALM Pluto SDR. Change it in the code if yours is configured differently. - The GUI may require PyQt6-specific themes for proper visualization — adjust as needed.
- 📶 Wi-Fi 2.4 GHz & 5 GHz
- 📱 LTE / GSM / AWS bands
- 🎧 Bluetooth devices
This project is licensed under the MIT License — feel free to use, modify, and share!
If you try this project and have feedback or improvements, feel free to open an issue or submit a pull request. Let's make SDR more accessible together!
- YouTube Channel: From Concept To Circuit
- GitHub: https://github.com/fromconcepttocircuit
- More RF & SDR projects coming soon!
#ADALMPluto #SpectrumAnalyzer #ElectromagneticWaves #RFSignals #PythonProjects #SDR #WirelessSignals