


pktstat-bpf is a lightweight replacement for the ncurses/libpcap-based pktstat, powered by a Linux eBPF (extended Berkeley Packet Filter) program. It is capable of gathering packet statistics even under very high traffic volumes — typically several million packets per second on an average server. In high-volume scenarios such as DoS attacks, traditional packet capture solutions often become unreliable due to increasing packet loss, making eBPF-based capture a more robust alternative.
At the end of execution, the program displays per-IP and per-protocol statistics sorted by per-connection bps, packet counts, and (source-IP:port, destination-IP:port) tuples.
The program consists of eBPF code written in C and a pure-Go userland component that parses and outputs final IP/port/protocol/bitrate statistics. The Go component uses the cilium/ebpf library to load and run the eBPF program and to interface with the eBPF map.
By default, the eBPF component uses TC (Traffic Control) eBPF hooks with TCX attaching, requiring at minimum Linux kernel v6.6, and collects both ingress and egress traffic statistics for TCP, UDP, ICMPv4, and ICMPv6. It can also switch to the faster XDP (eXpress Data Path) hook, at the cost of losing egress statistics since XDP operates only in the ingress path. XDP mode requires at minimum Linux kernel v5.9 due to its program-to-interface attachment calls. Some distributions (notably Red Hat Enterprise Linux) have backported XDP/TC patches, so the eBPF program may work on older kernels as well (see Requirements for details).
Alternatively, the tool can use KProbes to monitor TCP, UDP, ICMPv4, and ICMPv6 traffic across all containers, Kubernetes pods, NAT translations, and forwarded flows. In this mode, it also displays the process ID, process name, and cgroup path for traffic sent or delivered to a userspace application. KProbes operate closest to userspace and therefore have the highest overhead, but they provide uniquely useful process-level visibility. KProbes support older Linux kernels as well, with the hard dependency being a BTF-enabled kernel. The program resolves kernel-level cgroup IDs to cgroup paths (under /sys/fs/cgroup) by scanning the cgroup filesystem and consuming kernel cgroup mkdir events via dedicated eBPF code.
It is also possible to monitor a specific cgroup directly, with full support for both ingress and egress traffic. You can monitor all traffic by attaching to the root cgroup (e.g. /sys/fs/cgroup). Process tracking is available in cgroup mode, but only for traffic whose socket creation was observed by pktstat-bpf.

The author has given several eBPF talks, available below along with the accompanying slides:
- A shorter overview of eBPF features, capabilities, and implementation (35 minutes):
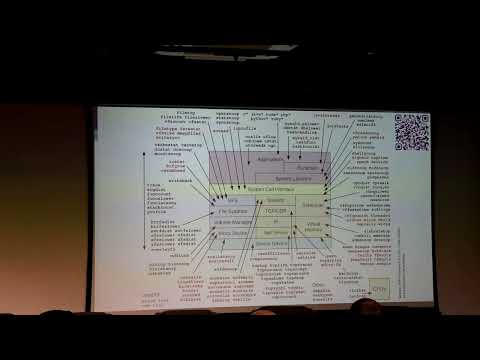
- A longer deep dive into eBPF features, capabilities, implementation, and security (~45 minutes, in Croatian):
The hard requirement for the eBPF program is Linux kernel 4.10 with BTF enabled; on such older kernels, KProbes will likely be the only supported mode (e.g. RHEL/CentOS 8, Debian 10). From kernel 5.9 onwards (RHEL/CentOS 9, Debian 11, Ubuntu 20.04), XDP mode is supported. TC may work as early as 5.14 (RHEL/CentOS 9) if the distribution has backported TC eBPF patches. On all recent distributions (RHEL/CentOS 9, Debian 12, Ubuntu 24.04), all eBPF modes are fully supported.
Loading eBPF programs typically requires root privileges. Additionally, pointer arithmetic in the eBPF code causes the eBPF verifier to reject non-root use explicitly. The kernel must have BTF enabled, and certain features require more recent kernels, as shown in the table below.
BPF JIT (Just-In-Time compilation) should be enabled for best performance (most Linux distributions enable this by default):
sysctl -w net.core.bpf_jit_enable=1In XDP mode, not all NIC drivers support Native XDP (where the XDP program is loaded by the NIC driver as part of the initial receive path; most common 10G drivers already support this) or Offloaded XDP (where the XDP program runs directly on the NIC hardware without using the CPU). If native or offloaded XDP is unavailable, the kernel falls back to Generic XDP, which offers reduced performance. Generic XDP requires no special NIC driver support, but operates much later in the networking stack, making its performance roughly equivalent to TC hooks.
The following table maps capture modes to their requirements and expected performance:
| Capture type | Ingress | Egress | Performance | Process tracking | Kernel required | SmartNIC required |
|---|---|---|---|---|---|---|
| Generic PCAP | Yes | Yes | Low | No | Any | No |
| AF_PACKET | Yes | Yes | Medium | No | v2.2 | No |
| KProbes | Yes | Yes | Medium+ | Yes (command, process ID, cgroup path) | v4.10 | No |
| Cgroup (SKB) | Yes | Yes | Medium+ | Partial (command, process ID) | v4.10 | No |
| TC (SchedACT) | Yes | Yes | High | No | v6.6 | No |
| XDP Generic | Yes | No | High | No | v5.9 | No |
| XDP Native | Yes | No | Very high | No | v5.9 | No |
| XDP Offloaded | Yes | No | Wire speed | No | v5.9 | Yes |
Lists of XDP-compatible drivers:
NAME
  pktstat-bpf

FLAGS
  -?, --help               display help
  -j, --json               if true, output in JSON format
  -c, --cgroup STRING      the path to a CGroup V2 to measure statistics on
  -x, --xdp                if true, use XDP instead of TC (this disables egress statistics)
  -k, --kprobes            if true, use KProbes for per-process TCP/UDP statistics
  -g, --tui                if true, enable TUI
      --version            display program version
  -i, --iface STRING       interface to read from (default: anpi4)
      --xdp_mode STRING    XDP attach mode (auto, generic, native or offload; native and offload require NIC driver support) (default: auto)
  -r, --refresh DURATION   refresh interval in TUI (default: 1s)
  -t, --timeout DURATION   timeout for packet capture in CLI (default: 10m0s)
Use --iface to specify the network interface to capture on.
--timeout stops the program after the specified duration. You can also interrupt it at any time with Ctrl-C, SIGTERM, or SIGINT.
--tui switches to a simple interactive TUI designed for continuous monitoring. Use the arrow keys to navigate the statistics table, and press q or x to exit.
--json outputs traffic statistics in JSON format.
--xdp switches from TC eBPF mode to XDP eBPF mode for higher performance, at the cost of disabling egress statistics. Note that the program may reset the interface on exit, so it is recommended to run it inside screen or tmux.
--xdp_mode overrides the XDP attach mode from the default auto (best-effort between native and generic) to native or offload, for NIC drivers or hardware that support those modes.
--kprobes switches to KProbe mode to track TCP and UDP traffic per process. Performance is lower compared to TC and XDP modes, but all per-process traffic is visible across all cgroups, containers, and Kubernetes pods. Additional details such as process command name, process ID, and control group are displayed.
--cgroup <path> measures ingress and egress traffic for the specified control group. Process command name and process ID are displayed when available.