![]()

Tree-based visualization for high-dimensional data. Organizes similar items into interactive tree structures — ideal for chemical space, protein embeddings, single-cell data, or any high-dimensional dataset.
A modernized reimplementation of the original TMAP with an sklearn-style API, multiple distance metrics, and interactive visualization.
Your Data
   ├─→ MinHash → LSHForest        (Jaccard)
   └─→ USearch                    (Cosine / Euclidean / other metrics)
                ↓
             k-NN Graph → MST → OGDF Tree Layout → Interactive Visualization
pip install tmap2Optional extras:
pip install rdkit          # chemistry helpers (fingerprints_from_smiles, molecular_properties)
pip install jupyter-scatter # notebook interactive widgets
Note: The import name is
tmap, nottmap2.
import numpy as np
from tmap import TMAP

# Binary fingerprints (Jaccard)
X = np.random.randint(0, 2, (1000, 2048), dtype=np.uint8)
model = TMAP(metric="jaccard", n_neighbors=20, seed=42).fit(X)
model.to_html("map.html")
# Dense embeddings (cosine / euclidean)
X = np.random.random((1000, 128)).astype(np.float32)
model = TMAP(metric="cosine", n_neighbors=20).fit(X)
new_coords = model.transform(X[:10])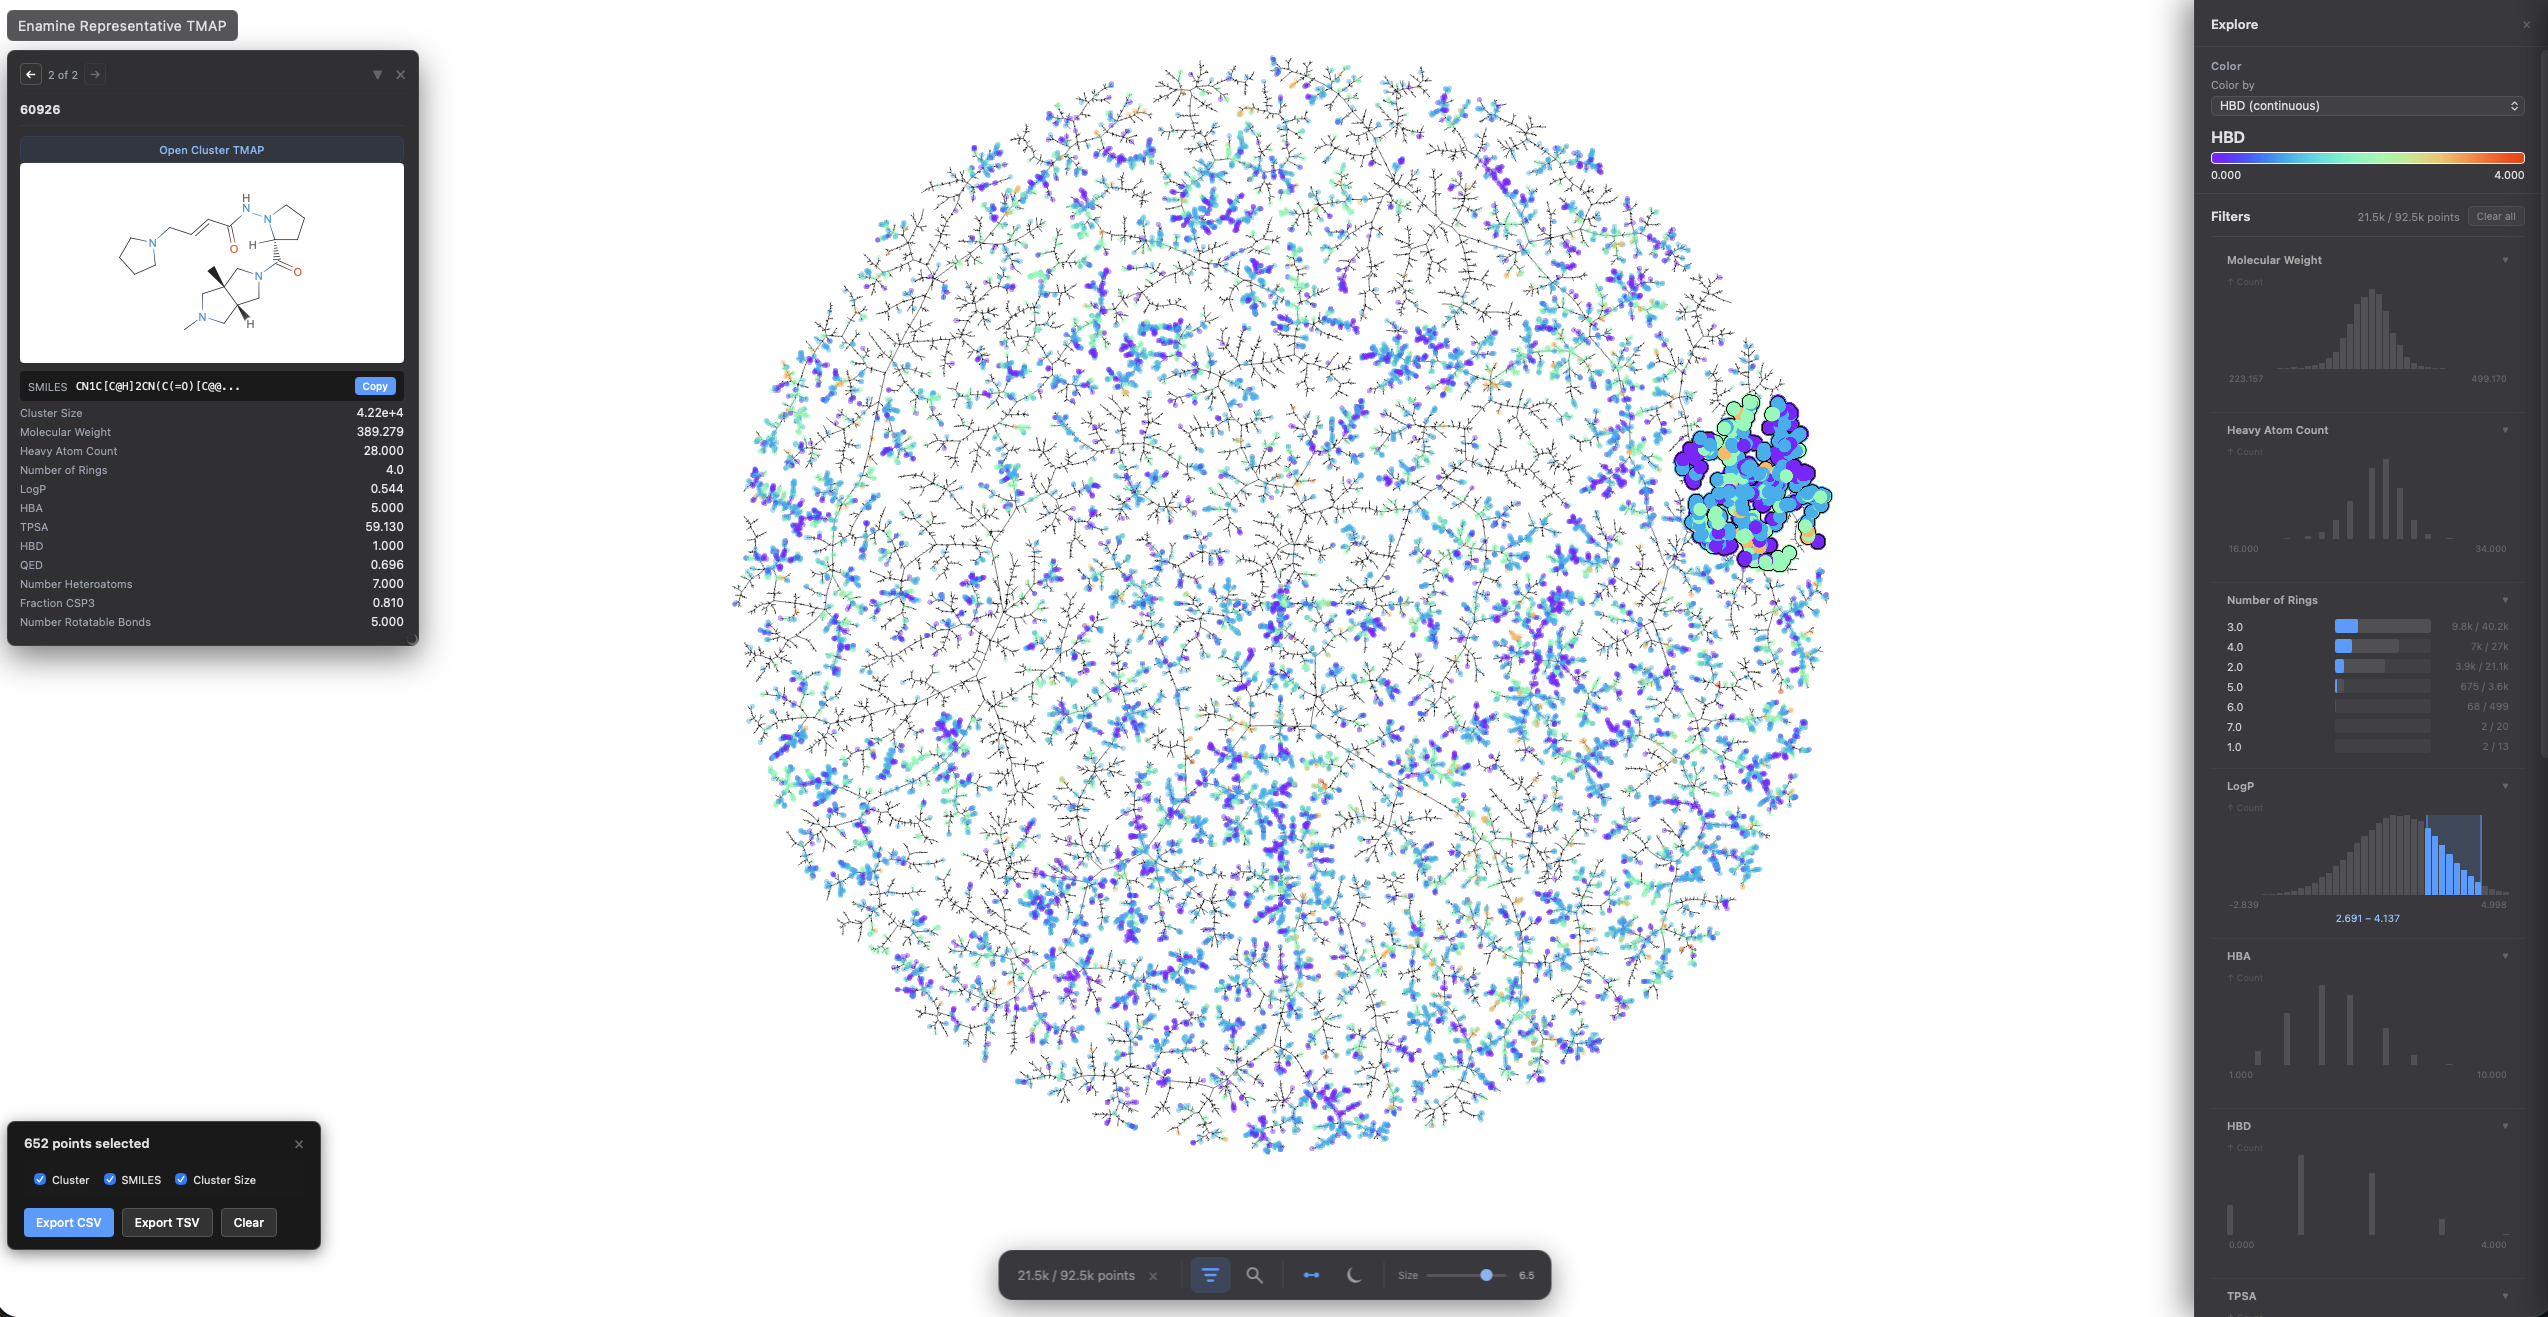
- Lasso selection (
Shift + drag) - Light / dark theme toggle
- Filter and search side panels
- Pinned cards for metadata, structures, and links
- Binary mode for large datasets
Color switching, categorical filtering, and lasso selection with pandas-backed metadata:
viz = model.to_tmapviz()
viz.add_color_layout("Molecular Weight", mw.tolist(), categorical=False)
viz.add_color_layout("Scaffold", scaffolds, categorical=True, color="tab10")
viz.add_label("SMILES", smiles_list)
viz.show(width=1000, height=620, controls=True)
Built-in helpers for common scientific workflows:
from tmap.utils.chemistry import fingerprints_from_smiles, molecular_properties
from tmap.utils.proteins import fetch_uniprot, sequence_properties
from tmap.utils.singlecell import from_anndata| Domain | Metric | Utilities |
|---|---|---|
| Chemoinformatics | jaccard |
fingerprints_from_smiles, molecular_properties, murcko_scaffolds |
| Proteins | cosine / euclidean |
fetch_uniprot, fetch_alphafold, read_pdb, sequence_properties |
| Single-cell | cosine / euclidean |
from_anndata, cell_metadata, marker_scores |
| Generic embeddings | cosine / euclidean / precomputed |
No domain utils needed |
For direct control over MinHash, LSH Forest, and layout stages:
from tmap import MinHash, LSHForest
from tmap.layout import LayoutConfig, layout_from_lsh_forest

mh = MinHash(num_perm=128, seed=42)
signatures = mh.batch_from_binary_array(X)

lsh = LSHForest(d=128, l=64)
lsh.batch_add(signatures)
lsh.index()

cfg = LayoutConfig(k=20, kc=50, deterministic=True, seed=42)
x, y, s, t = layout_from_lsh_forest(lsh, cfg)
# x, y = coordinates; s, t = tree edge indices- Deterministic: same input + seed = same output
- Multiple metrics:
jaccard,cosine,euclidean,precomputed - Incremental:
add_points()andtransform()for new data - Model persistence:
save()/load() - Three viz backends: interactive HTML, jupyter-scatter, matplotlib
git clone https://github.com/afloresep/TMAP.git
cd TMAP
pip install ".[dev]"
pytest -vMIT License - see LICENSE for details.
Based on the original TMAP by Daniel Probst and Jean-Louis Reymond.