Welcome to CoreTracer! A package for tracing Go applications, re-invented with all recent insights on metrics collection and tracing. It is a spiritual successor of statsd metrics, but with omitted "metrics" part to fully focus on tracing.
CoreTracer is built around go.opentelemetry.io/otel package and its Tracer interface. Any Otel-compatible pipeline can be used to collect and aggregate the traces collected by this tool.
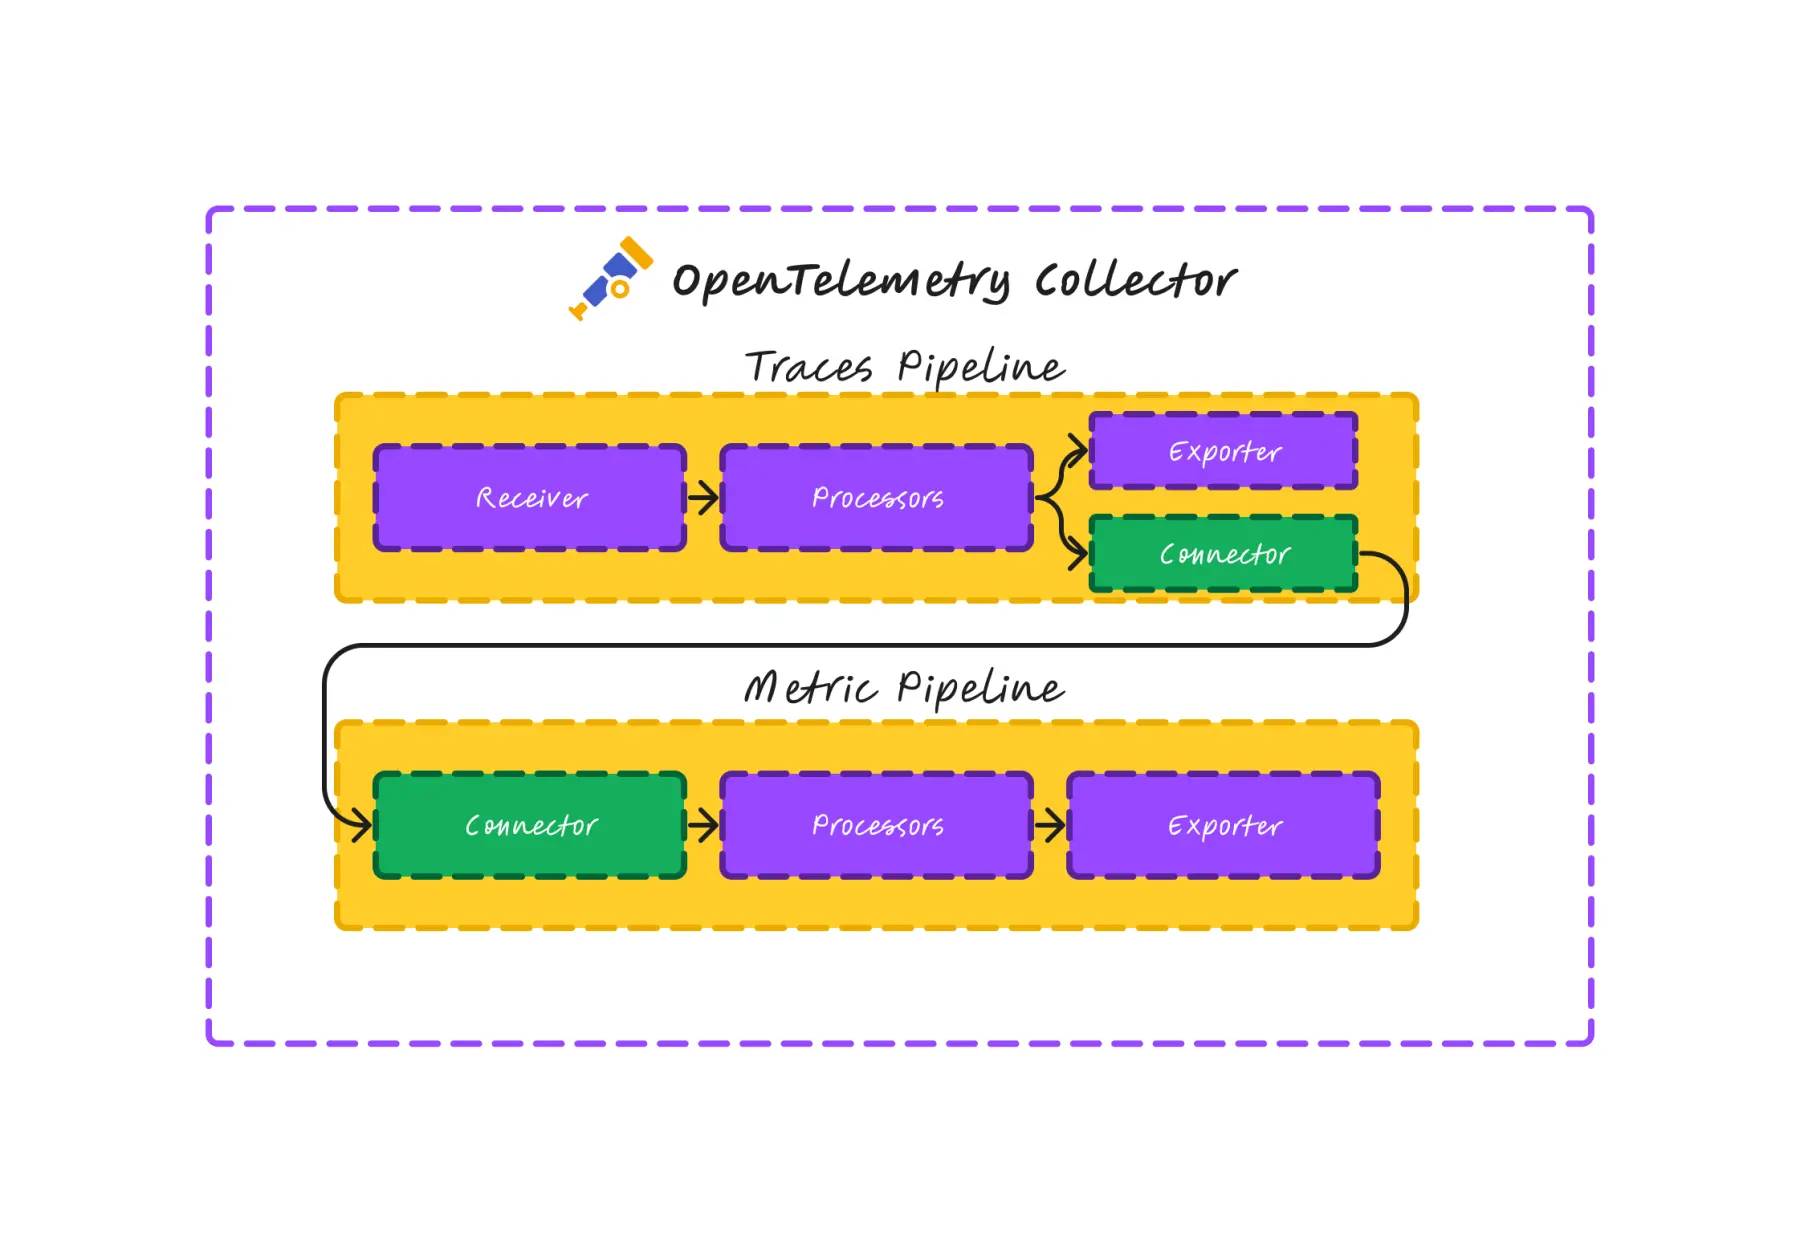
We anticipate to use the following OTel receivers:
There are certain ways to transform traces into metrics, a great article on this topic: https://newrelic.com/blog/nerdlog/transforming-traces
import "github.com/InjectiveLabs/coretracer"


type MyService struct {
    svcTags coretracer.Tags
}

func NewMyService() *MyService {
    return &MyService{
        svcTags: coretracer.NewTag("svc", "myService"),
    }
}

func (s *MyService) SomeFunc(ctx context.Context) error {
    defer coretracer.Trace(&ctx, s.svcTags)()

    // do a subcall
    s.SomeOtherFunc(ctx)

    err := db.Query(ctx, "SELECT * FROM users")
    if err != nil {
        coretracer.TraceError(ctx, err)
        return err
    }

    return nil
}

func (s *MyService) SomeOtherFunc(ctx context.Context) {
    defer coretracer.Trace(&ctx, s.svcTags)()
    // do something
}coretracer.Traceis used to initiate a span within a service methodcoretracer.TraceErroris used to end span, add the error and mark span as failedcoretracer.Tagsis used to add tags to the trace spancoretracer.NewTagis a shortcut forcoretracer.NewTagscoretracer.WithTagscan add more tags to the existing span.
The line defer coretracer.Trace(&ctx)() unfolds into the following runtime actions:
Trace()returns atype SpanEnderFn func()that ends span with a success and records the duration.- The end function is called when the method returns, so it's
deferred. - We pass a pointer to the context inteface (
*context.Context), so the context can be updated with the span data in-place. - The context is enriched with the span reference, so we can call
coretracer.TraceErroron the same context later. - Ending the span with
TraceErrorwill mark it as failed and add the error to the span, but also tombstone the context. - If the span ended with an error (and context is tombstoned), execution of the deferred
SpanEnderFnfunction will be no-op. - If user calls
TraceErroron a tombstoned context, it will emit a warning with a stacktrace in the logs, considered a programming error. - If user calls
TraceErroron a an empty or nil context, it will create a virtual span, e.g. viaTraceError(nil, err, tags) - Passing
nilcontext intoTracewill emit a warning with a stacktrace in the logs, considered a programming error. Falls back toTraceless(see below). - We avoid panics to make sure a smooth transition from the old
metricspackage.
ctx := context.Background()
fmt.Printf("pointer to context: %p\n", &ctx)
defer coretracer.Trace(&ctx)()
fmt.Printf("pointer to a new context: %p\n", &ctx)
It allows to keep a single return value of coretracer.Trace that can be used to end the span only.
- API surface must be minimal, user must only care about when methiod begins and when method fails.
- Only 1 call to coretracer is needed to measure method duration and status.
- Additional 1 call per erroring branch of code.
- User needs to pass the context to be able to trace the sequence of calls.
coretracer.Tags provides a way to add additional tags to the span. Note that tags for the span are managed before span is created.
svcTags := coretracer.NewTag("svc", "myService")

additionalTags := svcTags.WithTags(coretracer.NewTag("block_height", 3245674))

defer coretracer.Trace(&ctx, additionalTags)()
Sometimes tags only known at certain point of the span execution, so we can use WithTags to add them.
svcTags := coretracer.Tags{
    "svc": "myService",
}

defer coretracer.Trace(&ctx, svcTags)()

// much later

additionalTags := coretracer.NewTag("block_height", 3245674)

// coretracer.WithTags will fetch the span from the context and add tags to it
coretracer.WithTags(ctx, additionalTags)Sometimes, especially with Goroutines, we need to trace anonymous functions. There is a helper function coretracer.TraceWithName that can be used to trace a function and give it a name explicitly.
func SomeFunc(ctx context.Context) {
    defer coretracer.Trace(&ctx, "SomeFunc")()

    // run a goroutine
    go func() {
        defer coretracer.TraceWithName(&ctx, "SomeOtherFuncGoroutine")()
        // do something
        // ctx here holds the span of SomeOtherFuncGoroutine
    }()

    // ctx here holds the span of SomeFunc
    coretracer.WithTags(ctx, coretracer.NewTag("is_goroutine", false))
}
The trickiest of all tricks here is that the root context is captured as a value, so the reference to the context inside the goroutine closure will update only that child context with a value. The parent context of SomeFunc will hold the original value of the SomeFunc span.
While this sounds scary, a typical usage pattern is to just avoid overthinking and keep placing the coretracer.Trace* calls in the beginning of the most functions.
While spans are generated from the context, it's possible to create a span without it. This is still useful because the actual call stack can be deducted from the stack dump. This is the same as getting the function name from the latest stack frame, but instead, we get all the parent function names as well and construct a trace path out of many virtual spans.
Unfortunately, there is no way to get the timing of the parent spans. So, only the latest span will have the duration. We assume that there aren't many functions that lack a context.
import "github.com/InjectiveLabs/coretracer"


type MyService struct {
    svcTags coretracer.Tags
}

func NewMyService() *MyService {
    return &MyService{
        svcTags: coretracer.NewTag("svc", "myService"),
    }
}

func (s *MyService) SomeFuncWithoutContext() error {
    defer coretracer.Traceless(nil, s.svcTags)()

    // do a subcall
    s.SomeOtherFuncWithoutContext()

    return nil
}


func (s *MyService) SomeOtherFuncWithoutContext() {
    defer coretracer.Traceless(nil, s.svcTags)()
    // do something
}For the sake of API completeness, there is a TracelessWithName. But we discourage doing that.
func (s *MyService) SomeFuncWithoutContext() error {
    defer coretracer.Traceless(nil, s.svcTags)()

    // run a goroutine
    go func() {
        ctx := context.Background()
        defer coretracer.TracelessWithName(&ctx, "SomeOtherFuncGoroutine", s.svcTags)()

        // do stuff
        coretracer.WithTags(ctx, coretracer.NewTag("is_goroutine", true))
    }()

    return nil
}
Traceless won't care about the context that is nil. It will just create a span without prior context. If the context is set, it will be used to:
- Fetch an existing span from the context, if span exists,
coretracer.Tracelesswill act the same way ascoretracer.Trace. - If span doesn't exist, it will create a new span sequence from the runtime call stack.
- If the context is nil, it will not update the context with the span reference. Otherwise current span is set in the context.
coretracer.Traceis used to trace a method with a context.coretracer.Tracelessis used to trace a method without a context.coretracer.TraceWithNameis used to trace an anonymous closure with a given name.coretracer.TracelessWithNameis used to trace an anonymous closure without a context, with a given name.coretracer.Tagsis used to add tags to the span.coretracer.NewTagsis used to create a new set of tags.coretracer.NewTagis a shortcut forcoretracer.NewTagscoretracer.WithTagscan add more tags to the existing span.coretracer.TraceErroris used to end span, set the error and mark span as failed.
All tracing functions are here to collect as much info about call stack, associate tags and measure timing of function execution. They're designed to have very little overhead in terms of line code and runtime performance.
If tracing is disabled, all tracing functions are no-op and should not affect the runtime performance. Including the tags management - tag joins are heavy on GC if used in hot paths. So WithTags will no-op.
When enbled, the tracing info will be processed with OTal config and client and will be sent to the collecting backend.
Refer to the example's main.go for more details. The example will output the traces to local SigNoz instance.
cd example && go run main.go

[Hello!] We expect some SigNoz OTEL collector listening on DSN localhost:4317
...// TODO
// Endpoints, Enabled, Env vars, default buffer size